Xmipp Kerden Self-Organizing Map
Kerden SOM stands for 'Kernel Probability Density Estimator Self-Organizing Map'. It maps a set of high dimensional input vectors (aligned particles) onto a two-dimensional grid as described in Pascual-Montano et. al Journal of Structural Biology v133(2),233-245 (2001). Note that this method combines feature analysis and clustering into a single step.
General Workflow:
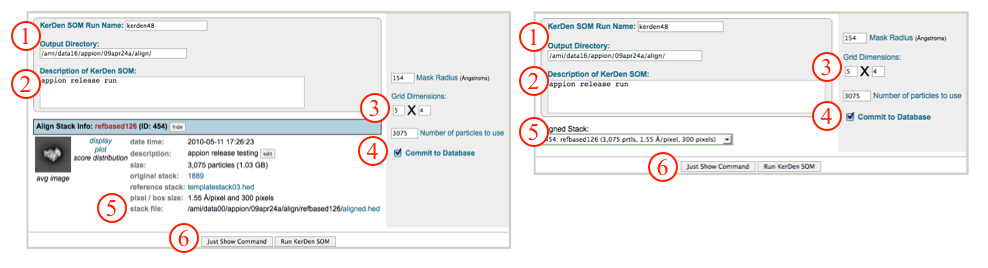
Note: If you accessed "Run Feature Analysis" directly from an alignment run, you will be greeted by the screen displayed on the left below. Alternatively, if you accessed the "Run Feature Analysis Run" from the Appion sidebar menu, you will be greeted by the screen displayed on the right below.
- Make sure that appropriate run names and directory trees are specified. Appion increments names automatically, but users are free to specify proprietary names and directories.
- Enter a description of your run into the description box.
- Check and/or change the dimensions of the two-dimensional grid (SOM) of averages that will be the output.
- Make sure that "Commit to Database" box is checked. (For test runs in which you do not wish to store results in the database this box can be unchecked).
- Check that the appropriate stack of aligned particles are being analyzed, or choose the appropriate stack from the drop-down menu. Note that stacks can be identified in this menu by alignment run name, alignment run ID, and that the number of particles, pixel and box sizes are listed for each.
- Click on "Run KerDen SOM" to submit your job to the cluster. Alternatively, click on "Just Show Command" to obtain a command that can be pasted into a UNIX shell.
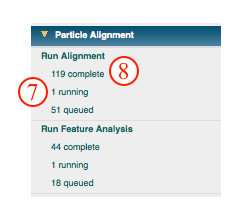
- If your job has been submitted to the cluster, a page will appear with a link "Check status of job", which allows tracking of the job via its log-file. This link is also accessible from the "1 running" option under the "Run Feature Analysis" submenu in the appion sidebar.
- Once the job is finished, an additional link entitled "1 complete" will appear under the "Run Feature Analysis" tab in the appion sidebar. Clicking on this link opens a summary of all feature analyses that have been done on this project.
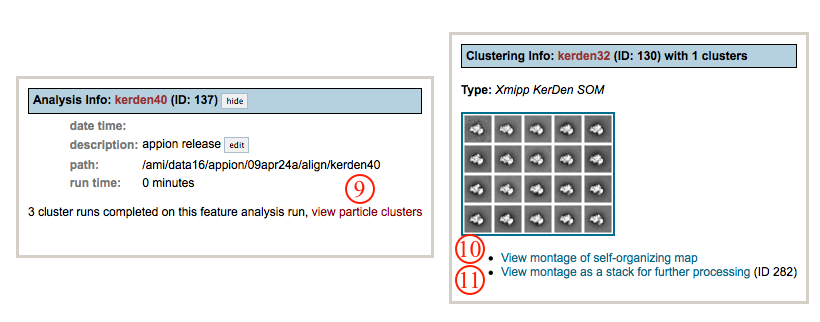
- To view the resulting SOM grid, click on the "view particle clusters" link. This opens a new window showing a summary of all clustering runs that have been performed.
- Click on "view montage of self-organizing map" to enlargen the montage image.
- Click on "view montage as a stack for further processing" to access a new window with tools for sub-stack creation and 3D reconstruction.
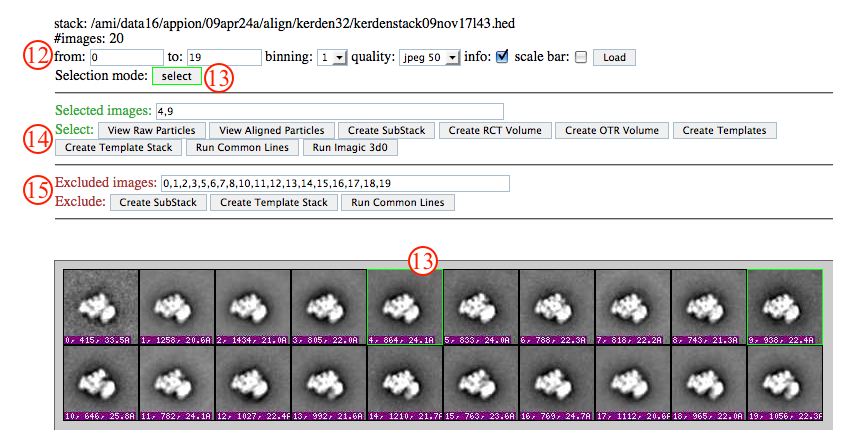
- In the further processing window, use the boxes and pull down menus to set the range, binning, quality, and info of images to display, and click "load" to affect setting changes.
- Change the mouse selection mode from exclude (red) to include (green), depending on your needs. Use your mouse to select images to include or exclude. Note that a list of included and excluded images is automatically generated.
- Select from the options to perform on selected images. A new tab will open for processing, and the current window will remain open so that you can come back and perform multiple operations.
- Alternatively, select from the options to perform on excluded images.
Notes, Comments, and Suggestions:
- The interactive mode of our webpages do not work with the Safari web-browers. Firefox works well.
- Clicking on "Show Composite Page" in the Feature Analysis List page (accessible from the "completed" link under "Run Feature Analysis" in the Appion sidebar) will expand the page to show the relationships between alignment, feature analysis, and clustering runs.
<Run Feature Analysis | Ab Initio Reconstruction >
Updated by Sargis Dallakyan over 4 years ago · 16 revisions