KLH Dataset I » History » Revision 43
« Previous |
Revision 43/52
(diff)
| Next »
Eric Hou, 07/23/2010 10:22 AM
Public Data Sets: KLH1
KLH Dataset I: 82 defocus pairs of micrographs, coordinate centers of ~1000 side-view particles, a preliminary 3D reconstruction.
NOTE: This is the standard dataset used in the particle selection "bakeoff" (JSB, vol. 145, pp. 3-14, 2004).
1. Images.
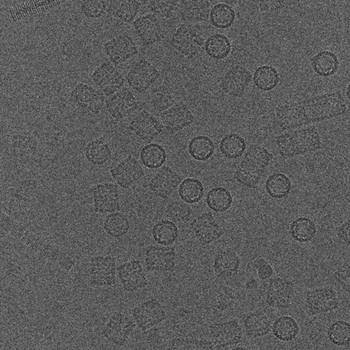
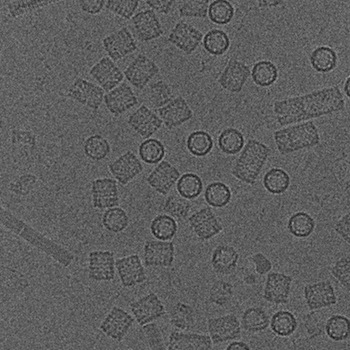
Images were acquired, using a Philips CM200 TEM equipped with a 2Kx2K CCD Tietz camera, as defocal pairs at a nominal magnification of 66,000x and a voltage of 120 KeV, using the Leginon system (Potter et al., 1999; Carragher et al., 2000). The first image (named *.001.mrc) is acquired at near to focus (NTF) conditions (~ -1µm) and the second image (named *.002.mrc) at farther from focus (FFF) conditions (~ -3µm). The time interval between the two exposures is approximately 20s due to camera readout time. Pixel size is 2.2Å at the specimen and the accumulated dose for each high magnification image area was ~10 e/Ų.
Below is an example of a defocus pair. Click on the images to see at full scale.
(a)  (b)
(b) 
(a) Near to focus - NTF image. (b) Far from focus - FFF image.
Figure 1: An example pair of high magnification images of KLH.
h3 Downloading High Magnification Images
Image files are provided in MRC format and as JPEG files. Use one of the following options to download the images.
- Download only far-from-focus (FFF) images: MRC files (384MB), JPEG files (94MB).
- Download only near-to-focus (NTF) images: MRC files (383MB), JPEG files (94MB).
We suggest using a tool called em2em, to convert MRC files to other formats.
2. Positions of the Picked Particles in the Images
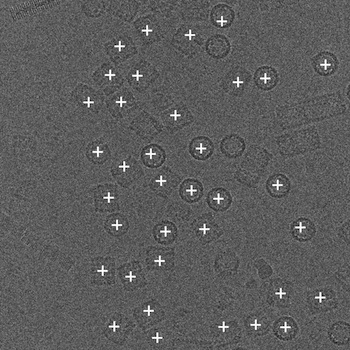
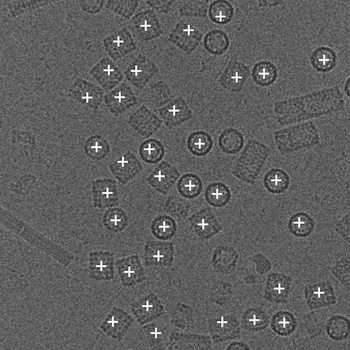
Particles are picked in the FFF images and these coordinates can be used to select particle in the NTF images. Particle form the NTF images were used in the recontruction. Phase correlation was used to align the two images to calculate the offset between the FFF coordinates and the NTF coordinates. We provide two sets of picks: (2.1) manual and (2.2) Selexon (Zhu et al., 2001).
(a)  (b)
(b) 
(a) The NTF image. (b) The FFF image.
Figure 2: An example pair of images outlined with particles automatically picked by Selexon. Each "+" indicate a detected particle.
2.1 Manual Picking:
The KLH didecamer presents in two main orientations, a rectangular sideview and a circular topview. Intermediate views, broken molecules and aggregates are also visible. From the 82 images, 1042 single particles were manually identified. Rectangular sideviews and intermediate orientations were selected with a percentage of ~95 % and ~5 %, respectively. No circular topviews were selected.
3. Positions of the Picked Particles in the Images
Since the NTF image in a defocus pair covers almost the same specimen area as the FFF image, the relative distance between particles within the NTF image should be the same as that in the FFF image. Using phase correlation, we are able to accurately align the NTF image to the FFF image in a defocus pair (Zhu et al., 2001). Therefore particles in the NTF image can be then extracted using the positions of the particles identified in the FFF image shifted according to the results of the alignment. Although only the particles selected in NTF images will be passed to the later reconstruction stage, we provide in the following only the positions of particles either manually or automatically picked in the FFF images.
(a)  (b)
(b) 
(a) The NTF image. (b) The FFF image.
Figure 2: An example pair of images outlined with particles automatically picked by Selexon. Each "+" indicate a detected particle.
As we mentioned in the introduction, particle picking is an open, unresolved problem. Even for biological experts, the final picks may vary from person to person. We therefore posted here more than one set of man or machine's picks. Besides posting the particles picked by our own program Selexon, we will also post other automated picks, such as those generated by Spider, EMAN, etc., upon available. For each set of picked particles, we give a brief description of the criteria for manual picks, or the algorithm for automated picks. Links to more detailed descriptions will be provided when available.
Table 1: Positions of Manual Picked Particles.
| Picker | Particle Picking Criteria in Picker's words | Links to download |
| Fabrice Mouche | The KLH didecamer presents two main orientations, a rectangular sideview and a circular topview. A cryoelectron microscopy field also shows the presence of intermediate views, of broken molecules and of aggregate of two or more particles. From the 82 images obtained with the CCD camera, 1042 single particles were manually and interactively extracted, using SPIDER and WEB (Frank et al., 1996). Only rectangular sideviews and intermediate orientations were selected with a percentage of 95 % and 5 %, respectively. No aggregate or "single" particle showing a different length, shorter or longer, was manually picked. Furthermore, to avoid any reconstruction artifact due to an overabundant type of views (Boisset et al., 1998), no circular topview was selected. The presence of a D5 point group symmetry and its application during the reconstruction procedure were sufficient to avoid any lack of structure information, especially along the Z-axis. | Coordinates of particles in the FFF images. |
Table 2: Positions of Automatically Picked Particles.
| Picker | Algorithm Description | Links to download |
| Selexon | An edge-based computational approach for automatic particle detection. Under this framework, first the Canny edge detector (Canny, 1986) is applied to cryo-EM images. Then, a sequence of ordered hough transforms (HTs) is either developed or adopted to detect particle contours in edge images. The sequence of HTs is applied in order from the computationally simplest one to the most complex one. Edge elements that are covered by the detected shapes are removed immediately from edge images following the application of the last HT. Hence, the next HT is applied to the edge image becoming equivalent to one that had not contained the detected shapes. By doing so, not only can we taper the effect of noisy edge elements on subsequent HTs, but also reduce significantly the total computational complexity. In the case of picking hemocyanon particles, a sequence of two types of HTs is necessary. First, circular particles are detected using the fast implementation of the Hough transform for the detection of circles , and edges covered by those detected circular regions are removed immediately; then rectangular Hough transform is developed to extract those approximately rectangle-shaped particles (Zhu et al., 2002). | Coordinates of particles in the FFF images. |
We have built a Tcl script to compare one person/machine's pick against another's, taking the first one's pick as the truth information. Using this tool, we build a confusion matrix among the current man/machine picks, listed at the bottom of this section.
Table 3: Confusion matrix obtained when comparing one pick against the others.
| Truth\Test | Fabrice Mouche | Selexon |
| Fabrice Mouche | FNR: 9.7% and FPR: 13.7% | |
| Selexon | FNR: 13.7% and FPR: 9,7% |
Note: FNR represents false negative rate; FPR represents false positive rate.
4. Sample 3D Reconstructions and a Preliminary 3D Map
Table 4: Sample 3D reconstructions generated using particles selected either manually or automatically.
| Picker | Three-dimensional Density Map | Description of Reconstruction Procedures | Comments |
| Fabrice Mouche |   |
A D5 point-group symmetry was imposed. The series of 1042 particles was subjected to three cycles of 3D projection alignment, using a previous volume as a reference, and a new reconstruction volume was calculated. | Coordinates of particles went into the map. |
| Selexon |   |
A D5 point-group symmetry was imposed. The series of 1243 particles was subjected to three cycles of 3D projection alignment, using a previous volume as a reference, and a new reconstruction volume was calculated. | None. |
Note: A preliminary 3-D map of the particle is also available in two different formats: MRC format and SPIDER format. (The size of the map files are about 46 MB after being gzip'ed).
5. References
- Boisset, N., et al. (1998) Overabundant single-particle electron microscope views induce a three-dimensional reconstruction artifact. Ultramicroscopy 74: 201-207.
- Canny, J. (1986) A computation approach for edge detection. IEEE Trnas. Patt. Analy. and Machine Intell. 8: 679-698.
- Carragher, B., Kisseberth, N., Kriegman, D., Milligan, R. A., Potter, C. S., Pulokas, J., and Reilein, A. (2000) Leginon: An automated system for acquisition of images from vitreous ice specimens. J. Struct. Biol. 132: 33-45.
- Frank, J., et al. (1996) SPIDER and WEB: processing and visualization of images in 3D electron microscopy and related fields. J. Struct. Biol. 116(1): 190-9.
- Potter, C. S., Chu, H., Frey, B., Green, C., Kisseberth, N., Mad-den, T. J., Miller, K. L., Nahrstedt, K., Pulokas, J., Reilein, A., Tcheng, D., Weber, D., and Carragher, B. (1999) Leginon: A system for fully automated acquisition of 1000 micrographs a day. Ultramicroscopy 77: 153-161.
- Zhu, Y., B. Carragher, D. Kriegman, R. Milligan, and C. Potter (2001) Automated Identification of Filaments in Cryo-electron Microscopy Images. J. Struct. Biol. 135: 302-312.
- Zhu, Y., Carragher, B., and Potter, C. S. (2003) Automatic Particle Detection Through Efficient Hough Transforms. IEEE Transactions on Medical Imaging 22(9): 1053-1062.
Updated by Eric Hou almost 14 years ago · 43 revisions