Feature #5978
closedDisplay Holefinder ice thickness in image viewer?
0%
Description
Hi Anchi,
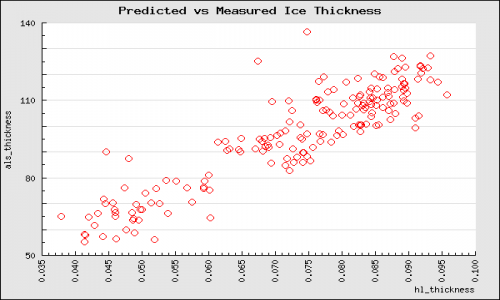
Having the plot of Holefinder ice thickness vs ALS ice thickness in the summary page is really helpful! Would it be possible to also display the holefinder ice thickness next to the ALS ice thickness in image viewer (e.g see attached)? This would be helpful when tweaking ice thickness thresholds for exposure target rejection during automated data collection.
Likewise, having some metrics for exposure targets that have not been selected for collection on either a per image or total dataset level would be helpful. For example, a "rejected targets" section in the information page for hln images, with statements such as "3 targets were rejected because they exceeded the maximum ice thickness threshold" would be helpful when monitoring data collection remotely and deciding whether adjustments need to be made.
Cheers
Oli
Files
Updated by Anchi Cheng about 7 years ago
- Status changed from New to Assigned
- Assignee set to William Rice
Updated by William Rice about 7 years ago
Again the individual leginon values for the "hl" image thickness are quite noisy, so I don't think that seeing individual values are particularly helpful. Examination of the actual plot is probably more informative since that will also tell you how noisy the values are and you can generate good estimates from there.
I will look into mining metadata for hl images, as to how many were rejected.
Updated by Anchi Cheng over 6 years ago
- Status changed from Assigned to Won't Fix or Won't Do
Updated by Oliver Clarke over 6 years ago
Hi Bill,
They are noisy, I agree, but I find it helpful to see the individual values in addition to the graph, because it allows one to directly correlate with particle distribution. I use these values a lot for setting exposure targeting and it seems to work well. Otherwise I have to look at the IceT ice thickness, convert it to an approx holefinder ice thickness threshold using the graph, and then set a threshold based on that, which personally I find more convoluted, but I understand if it is something you don't think worth adding. I still think it would be a useful statistic to be able to access somewhere in the image info though.
Cheers
Oli
William Rice wrote:
Again the individual leginon values for the "hl" image thickness are quite noisy, so I don't think that seeing individual values are particularly helpful. Examination of the actual plot is probably more informative since that will also tell you how noisy the values are and you can generate good estimates from there.
I will look into mining metadata for hl images, as to how many were rejected.