Bug #2903
closedmakestack slows to a crawl when making big stacks
0%
Description
I'm having an issue where makestack slows to a crawl when making big stacks. The slowdown happens at the commit step, and commits take progressively longer as the stack gets bigger and bigger. I think this relates to the issues with commit slowness in general and has to do with the way we do inserts with sinedon. Unfortunately, I think a substantial effort will be required to fix this. The upshot is that I think everything would get a lot faster if we do it right. I suggest that this is something we should talk about at our first Google hangout thing.
Files
Updated by Neil Voss about 11 years ago
Obviously, this is a common issue. I wonder if we can test if there is a correlation with the size of the database and the commit time. Does it relate to the number of particles in the appion database? Or is it the size of the Leginon database? Because things seem slower at AMI than my system even on smaller Appion projects.
If we can isolate the problem better, maybe we can come up with a solution that requires less of a overhaul of sinedon.
Updated by Clint Potter about 11 years ago
- Assignee set to Anchi Cheng
Possible short term solution is to force function during upload w/ force=true where insert of particles in stack. Anchi will look into this and test on her sandbox database. Anchi will create a test case.
Updated by Neil Voss about 11 years ago
I did a quick survey of inserting lots of particles (this is tilt picker particle selection NOT makestack, but should be the same). The appion database was fairly new with only about 100,000 particles in it.
Inserting 3353 particles, sinedon.insert() without force:
3300 particles remain, 70.75 msec per particle, 3.54 sec last 50 particles
3250 particles remain, 71.38 msec per particle, 3.60 sec last 50 particles
3200 particles remain, 71.96 msec per particle, 3.66 sec last 50 particles
3150 particles remain, 72.55 msec per particle, 3.72 sec last 50 particles
3100 particles remain, 73.15 msec per particle, 3.78 sec last 50 particles
3050 particles remain, 73.75 msec per particle, 3.84 sec last 50 particles
3000 particles remain, 74.38 msec per particle, 3.91 sec last 50 particles
2950 particles remain, 74.99 msec per particle, 3.96 sec last 50 particles
2900 particles remain, 75.62 msec per particle, 4.03 sec last 50 particles
...
250 particles remain, 112.10 msec per particle, 7.99 sec last 50 particles
200 particles remain, 112.88 msec per particle, 8.05 sec last 50 particles
150 particles remain, 113.65 msec per particle, 8.13 sec last 50 particles
100 particles remain, 114.43 msec per particle, 8.20 sec last 50 particles
 50 particles remain, 115.20 msec per particle, 8.27 sec last 50 particles
notice the increasing time it takes to insert more particles, more than doubling over the insert process.
Inserting 3714 particles, sinedon.insert(force=True) WITH force:
3650 particles remain, 108.77 msec per particle, 5.50 sec last 50 particles
3600 particles remain, 110.07 msec per particle, 5.59 sec last 50 particles
3550 particles remain, 110.98 msec per particle, 5.65 sec last 50 particles
3500 particles remain, 111.77 msec per particle, 5.72 sec last 50 particles
3450 particles remain, 112.51 msec per particle, 5.78 sec last 50 particles
3400 particles remain, 113.23 msec per particle, 5.85 sec last 50 particles
3350 particles remain, 113.94 msec per particle, 5.92 sec last 50 particles
3300 particles remain, 114.67 msec per particle, 6.00 sec last 50 particles
3250 particles remain, 115.38 msec per particle, 6.06 sec last 50 particles
3200 particles remain, 116.09 msec per particle, 6.13 sec last 50 particles
3150 particles remain, 116.81 msec per particle, 6.21 sec last 50 particles
...
250 particles remain, 151.02 msec per particle, 9.02 sec last 50 particles
200 particles remain, 151.49 msec per particle, 9.19 sec last 50 particles
150 particles remain, 151.93 msec per particle, 9.14 sec last 50 particles
100 particles remain, 152.38 msec per particle, 9.23 sec last 50 particles
 50 particles remain, 152.83 msec per particle, 9.27 sec last 50 particles
for tiltpicker the insert() occurs for particle pairs not individual particles, so I add two more force inserts. Also, it was actually running a query of the partpair before inserting, an unnecessary a double check.
partq1.insert(force=True)
partq2.insert(force=True)

partpairq['particle1'] = partq1
partpairq['particle2'] = partq2
partpairq.insert(force=True)
Inserting 4331 particles, sinedon.insert(force=True) WITH force:
4250 particles remain, 6.45 msec per particle, 315.46 msec last 50 particles
4200 particles remain, 6.38 msec per particle, 312.47 msec last 50 particles
4150 particles remain, 6.35 msec per particle, 314.31 msec last 50 particles
4100 particles remain, 6.34 msec per particle, 315.51 msec last 50 particles
4050 particles remain, 6.33 msec per particle, 312.62 msec last 50 particles
4000 particles remain, 6.32 msec per particle, 314.91 msec last 50 particles
3950 particles remain, 6.31 msec per particle, 312.53 msec last 50 particles
3900 particles remain, 6.31 msec per particle, 313.59 msec last 50 particles
3850 particles remain, 6.30 msec per particle, 313.13 msec last 50 particles
...
250 particles remain, 6.28 msec per particle, 312.38 msec last 50 particles
200 particles remain, 6.28 msec per particle, 313.18 msec last 50 particles
150 particles remain, 6.28 msec per particle, 313.17 msec last 50 particles
100 particles remain, 6.28 msec per particle, 313.06 msec last 50 particles
 50 particles remain, 6.28 msec per particle, 312.74 msec last 50 particles
Wow, that was fast!!!
Updated by Anchi Cheng about 11 years ago
Neil,
Thanks for trying it out. As to Bridget's concern about affecting down stream processing, I think the important thing is that for it not to force on the first image it processes in case that the previous trial of the same run was interrupted during insertion, which caused the continued run still have particles that it needs to insert.
Updated by Neil Voss about 11 years ago
- Status changed from New to Assigned
- Priority changed from Normal to Urgent
Updated by Neil Voss almost 11 years ago
- Related to Bug #2939: Appion Developers Conference Call Notes added
Updated by Neil Voss almost 11 years ago
Suggested switching MySQL engine from MyISAM to InnoDB. This may allow more parallelization of our SQL queries.
https://en.wikipedia.org/wiki/Comparison_of_MySQL_database_engines
Updated by Neil Voss almost 11 years ago
Is there slowness for Guppy vs. Garibaldi?
Updated by Clint Potter almost 11 years ago
Discussed during Appion conference call. Gabe spoke to Anchi and Sargis. SQL upload is slowest part of any processing. Could possibly update to new version of SQL which can parallelize rather than going to single thread. Anchi says switch mySQL database to inodb engine. Anchi tried this but Sinedon doesn't seem to work with this. Sargis will look into inodb engine.
Anchi says guppy stackload is much faster than Garibaldi. Anchi will test.
Updated by Anchi Cheng almost 11 years ago
my test with fishtail (mini database server for one project) database on two computers making 20,000 particle stack.
The images are on /ami/data00 and the appion run is on /ami/data15
amilab7:
Timing stats
Batch Boxer: 2.09 +/- 0.47 sec (11.40 percent)
Ctf Correction: 7.08 +/- 0.67 sec (38.63 percent)
Stack Merging: 0.89 +/- 0.5 sec (4.85 percent)
Mean/Std Read: 2.0 +/- 0.62 sec (10.92 percent)
DB Insertion: 1.01 +/- 0.54 sec (5.50 percent)
COMPLETE LOOP:    54 min 23 sec for 174 images
garibaldi myami queue
Timing stats
Batch Boxer: 3.24 +/- 2.67 sec (8.08 percent)
Ctf Correction: 13.0 +/- 6.95 sec (32.37 percent)
Stack Merging: 8.63 +/- 5.1 sec (21.49 percent)
Mean/Std Read: 2.16 +/- 0.62 sec (5.38 percent)
DB Insertion: 2.92 +/- 2.28 sec (7.28 percent)
COMPLETE LOOP:  2 hr 2 min for 174 images
DB insertion is 3x faster from amilab7 than garibaldi but that is not why it was twice as slow. Stack merging is 8x slower on garibaldi.
Will do a test with substack making which has fewer extra operation.
Updated by Anchi Cheng almost 11 years ago
substack making stats
garibaldi:
database insertion:
1-5000: 103 sec
5001-10000: 114 sec
amilab7
database insertion:
1-5000: 66 sec
5001-10000: 66 sec
Just insertion test on garibaldi
5000 of 50000 complete ... last 5000 time:       90.1
10000 of 50000 complete ... last 5000 time:       91.9
15000 of 50000 complete ... last 5000 time:       85.7
20000 of 50000 complete ... last 5000 time:       89.3
25000 of 50000 complete ... last 5000 time:       88.8
30000 of 50000 complete ... last 5000 time:       88.4
35000 of 50000 complete ... last 5000 time:       89.4
40000 of 50000 complete ... last 5000 time:       89.4
45000 of 50000 complete ... last 5000 time:       88.4
50000 of 50000 complete ... last 5000 time:       89.9
Just insertion test on amilab7
5000 of 50000 complete ... last 5000 time:       65.0
10000 of 50000 complete ... last 5000 time:       64.8
15000 of 50000 complete ... last 5000 time:       65.6
20000 of 50000 complete ... last 5000 time:       65.7
25000 of 50000 complete ... last 5000 time:       66.8
30000 of 50000 complete ... last 5000 time:       66.5
35000 of 50000 complete ... last 5000 time:       66.7
40000 of 50000 complete ... last 5000 time:       66.0
45000 of 50000 complete ... last 5000 time:       64.9
50000 of 50000 complete ... last 5000 time:       64.9
It is slower on garibaldi but there is no sign of slowing down.
Updated by Neil Voss almost 11 years ago
Does anyone have any idea where the 8x factor comes from??
Hard drive speeds. I am sure it has gotten better, but garibaldi always had a slow filesystem when I was there.
Updated by Gabriel Lander almost 11 years ago
Here's the results I get running the same script on our database, it appears to be more than 3 times slower. This combined with the slower filesystem (if that's the case) is killing us.
5000 of 50000 complete ... last 5000 time: 312.1
10000 of 50000 complete ... last 5000 time: 302.0
15000 of 50000 complete ... last 5000 time: 302.5
20000 of 50000 complete ... last 5000 time: 303.3
25000 of 50000 complete ... last 5000 time: 302.3
30000 of 50000 complete ... last 5000 time: 302.2
35000 of 50000 complete ... last 5000 time: 303.7
40000 of 50000 complete ... last 5000 time: 306.3
45000 of 50000 complete ... last 5000 time: 304.9
50000 of 50000 complete ... last 5000 time: 307.3
Updated by Sargis Dallakyan almost 11 years ago
Gabe's db is running on older hardware with spinning disks. Anchi's tests are running on a newer hardware with more RAM and solid state drives. I did Google search for comparison of MySQL database engines (MyISAM vs InnoDB) and found these links:
http://dba.stackexchange.com/questions/16395/mysql-insert-performance-innodb-vs-myisam
http://dba.stackexchange.com/questions/17431/which-is-faster-innodb-or-myisam
I've also looked into issue with installing Appion on a newer systems with MySQL 5.5.x when users get FULLTEXT indexes error. It seems that InnoDB full-text search is finally available in MySQL 5.6.4 release - http://stackoverflow.com/questions/1381186/fulltext-search-with-innodb
I'll need to learn how to run theses tests myself and maybe try running substack making stats on the same hardware to compare MyISAM vs InnoDB.
Updated by Bridget Carragher almost 11 years ago
Great info, thanks Sargis. Would be good to get this one sorted out and probably good to go over to the more modern tools anyway.
Updated by Anchi Cheng almost 11 years ago
Ran similar insert on amilab7 using database on cronus4
5000 of 50000 complete ... last 5000 time:       98.1
10000 of 50000 complete ... last 5000 time:       83.9
15000 of 50000 complete ... last 5000 time:       80.6
20000 of 50000 complete ... last 5000 time:       83.0
25000 of 50000 complete ... last 5000 time:       81.7
30000 of 50000 complete ... last 5000 time:       91.2
35000 of 50000 complete ... last 5000 time:      101.6
40000 of 50000 complete ... last 5000 time:       92.8
45000 of 50000 complete ... last 5000 time:       82.5
50000 of 50000 complete ... last 5000 time:       82.9
Updated by Gabriel Lander almost 11 years ago
Ok good, so it's not my imagination - cronus5 is definitely slower. Any ideas what could be going on? Anyone?
Updated by Sargis Dallakyan almost 11 years ago
I did some tests to compere MyISAM vs InnoDB for storage engines and it seems that MyISAM performs better for making big stacks. I've used Anchi's test2.py and dewey host that has a copy of cronus4 database stored on a hard disk drive (Model: ATA ST3000DM001-9YN1).
With Server version: 5.5.38 - MySQL Community Server (GPL)
[sargis@dewey test_particle_insert]$ ./test2.py --old-stack-id=90 -description='test insert speed all together' --commit --rundir=. --runname=subtest6 --projectid=450 --expid=14060 --trials=10
...
5000 of 50000 complete ... last 5000 time: 49.8
...
With mariadb-10.0.15-linux-x86_64
[sargis@dewey test_particle_insert]$ ./test2.py --old-stack-id=90 -description='test insert speed all together' --commit --rundir=. --runname=subtest6 --projectid=450 --expid=14060 --trials=10
...
5000 of 50000 complete ... last 5000 time: 61.3
...
[root@dewey ap450]# ls alh ApStackParticleData.* 1 mysql mysql 9.1K Jun 1 11:10 ApStackParticleData.frm
-rw-rw---rw-rw--- 1 mysql mysql 591M Nov 26 10:48 ApStackParticleData.MYDrw-rw--- 1 mysql mysql 410M Nov 26 10:48 ApStackParticleData.MYI
[root@dewey ap450]# pwd
/extra/mysql/ap450
After changing Database: ap450 »Table: ApStackParticleData Storage Engine from MyISAM to InnoDB:
[root@dewey ap450]# ls alh ApStackParticleData.* 1 mysql mysql 3.4K Nov 26 10:51 ApStackParticleData.frm
-rw-rw---rw-rw--- 1 mysql mysql 1.3G Nov 26 10:57 ApStackParticleData.ibd
[sargis@dewey test_particle_insert]$ ./test2.py --old-stack-id=90 -description='test insert speed all together' --commit --rundir=. --runname=subtest6 --projectid=450 --expid=14060 --trials=10
...
5000 of 50000 complete ... last 5000 time: 78.1
...
I've also run another test with innodb_buffer_pool_size=20G following Optimizing InnoDB Disk I/O and the results were similar to the above.
It seems that when attached test2.py is run mutiple times, most of the time goes on quering database. Here is the output when the above command is run with python profiler (python -m cProfile -s time)
   Ordered by: internal time

   ncalls  tottime  percall  cumtime  percall filename:lineno(function)
    15070   71.361    0.005   71.361    0.005 {method 'query' of '_mysql.connection' objects}
  1544165    1.198    0.000    1.199    0.000 {isinstance}
    70092    1.165    0.000    1.519    0.000 {eval}
    15067    1.000    0.000    1.000    0.000 {method 'ping' of '_mysql.connection' objects}
   570592    0.951    0.000    1.170    0.000 ordereddict.py:21(__setitem__)
275277/5023    0.804    0.000    2.468    0.000 sqlexpr.py:75(sqlRepr)
   230239    0.792    0.000    2.345    0.000 data.py:519(__setitem__)
    25062    0.678    0.000    2.528    0.000 newdict.py:58(__init__)
   230239    0.648    0.000    1.073    0.000 newdict.py:70(__setitem__)
    10013    0.583    0.000    0.583    0.000 {method 'stat' of '_mysql.connection' objects}
   683123    0.447    0.000    0.447    0.000 {method 'append' of 'list' objects}
   195449    0.398    0.000    1.204    0.000 {map}
135127/5023    0.365    0.000    2.451    0.000 sqlexpr.py:205(sqlRepr)
...
It seems that test2.py doesn't insert prticles into ApStackParticleData if there are already there. I've changed newstackq.insert() to newstackq.insert(force=True) in commitStackParticles and results are as follows:
with InnoDB engine:
5000 of 5000 complete ... last 5000 time: 607.3
with MyISAM engine:
5000 of 5000 complete ... last 5000 time: 44.0
This indicates that MyISAM engine (current default for our production server cronus4) is faster compared to InnoDB engine when making big stacks.
Updated by Neil Voss almost 11 years ago
I do not know much about MySQL, but can we add this to the my.cnf file?
concurrent_insert=ALWAYS
Updated by Sargis Dallakyan almost 11 years ago
I've run this on a test server (dewey) with mariadb-10.0.15-linux-x86_64 and added concurrent_insert=ALWAYS to the my.cnf file. The results were similar to the previouse runs. After reading http://dev.mysql.com/doc/refman/5.0/en/server-system-variables.html#sysvar_concurrent_insert and http://dev.mysql.com/doc/refman/5.5/en/concurrent-inserts.html I see that we are using the default concurrent_insert=1 on cronus4 (i.e. there is no concurrent_insert in the my.cnf file).
Updated by Sargis Dallakyan almost 11 years ago
- Workaround updated (diff)
Summary
Using force=True in sinedon insert makes it faster to insert new rows in the tables. By default, force=0 in sinedon/sqldict.py which forces it to query tables before inserting a new row.
Having faster CPU, more RAM and solid states drives on MySQL server (vertical scaling) can also have big impact on the performance.
Another option to consider is reducing the number of columns in ApStackParticleData table. Currently it has these columns:
DEF_id DEF_timestamp particleNumber REF|ApStackData|stack REF|ApStackRunData|stackRun REF|ApParticleData|particle mean stdev min max skew kurtosis edgemean edgestdev centermean centerstdev
Maybe it would be better to compute these additional statistics on the fly, when they are needed, instead of storing them in the table.
Updated by Anchi Cheng almost 11 years ago
Changing sinedon/sqldict.py to force=True will accumulate data way to fast, I think. The way sinedon is used, the insert is done recursively. If this is set to force=True, it will add, for example, the Leginon session data to SessionData several thousand times per session that takes one thousand images, at least.
You have to do this on specific cases of stack particle insertiong or particle insertion.
Updated by Gabriel Lander almost 11 years ago
Something is really really wrong with Cronus5/garibaldi. It's running absurdly slow. I'm about to rm -rf * myami.
5000 of 50000 complete ... last 5000 time: 2016.6
10000 of 50000 complete ... last 5000 time: 2045.2
15000 of 50000 complete ... last 5000 time: 2104.2
20000 of 50000 complete ... last 5000 time: 2402.3
25000 of 50000 complete ... last 5000 time: 2092.1
30000 of 50000 complete ... last 5000 time: 2110.4
35000 of 50000 complete ... last 5000 time:
Updated by Anchi Cheng almost 11 years ago
Gabe,
Have you check disk usage on cronus5 ? Is it possible that it is filling up ? Also worth getting the size of database and tables of the ap database you are inserting them into. If it is not a network problem, full disk is a very good reason for trouble.
Updated by Sargis Dallakyan almost 11 years ago
I've got another bug #2992 about garibaldi taking much longer than guppy to upload. I gave JC sudoers access to cronus5 so he can replicate the setting on the new database server. It would be interesting to see what the numbers look like on this new server. Dmitry is also reported latency issues with database server at salk.edu. This seems to be a networking issue. Last I checked on cronus5, half of the disk space was still available. We tried to teak some of the settings on the database server at salk.edu with Dmitry, but nothing helped.
This seems to be a limitation of MySQL database server: for good speed and connectivity it should be <1ms and single hop (quoted from http://forums.cpanel.net/f354/remote-database-server-what-acceptable-distance-latency-354951.html).
In regard to the original bug reported by Scott, I have implemented a checkbox in the GUI for makestack2 so that it will be used in sinedon.insert(force=True). I'll analyse the results tomorrow and commit them if it works.
Updated by Gabriel Lander almost 11 years ago
To add another datapoint - I tried running the same script on a new processing database for a project that contains only 1 session. I have the same slow results, so this doesn't have anything to do with the number of entries in the processing database.
Updated by Sargis Dallakyan almost 11 years ago
- Status changed from Assigned to In Code Review
- Workaround updated (diff)
Added Fast Insert checkbox with 'Insert new entries without checking if corresponding data already exists' popup on mouseover in r18695.
This has no effect for making stacks with around 100 particles, but it considerebly reduces runtime for making big stacks. Here are the result for a test case with around 10000 particles that I run on guppy using dewey as a dababase server:
Total run time: 1 hr 32 min - with Fast Insert checked.
Total run time: 5 hr 12 min - with Fast Insert unchecked.
Updated by Sargis Dallakyan over 10 years ago
- Assignee changed from Anchi Cheng to Sargis Dallakyan
Will need a test case and possibly redo sinedon part.
Updated by Bridget Carragher over 10 years ago
Anchi and I chatted about this some more after the meeting. I think it is essential to locate the source of the problem first. Seems to us that the slow down being the results of a database query or insert does not make sense (which of course does not mean that it is not true!). But these databases are designed to do enormous queries of millions of tables etc. and so going from 1 particle to 100,000 should not make any difference to it.
So some proposed tests as discussed today:
1. Gabe will test Anchi script and report back.
- If it shows a slowing down then Sargis can you please test it on goby or guppy as a cross test.
- If Gabe test is slowing and Sargis test is also slowing then the db is the issue and we ask Sargis to prioritize trying to figure this out.
- If Gabe test is slowing and Sargis test is not then we need to try the script on another cluster.
- If only garibaldi is slowing then we need to talk to JC or someone like him.
- if neither Gabe test or Sargis test is slowing then we need to look elsewhere for the culprit.
2. If we need to look elsewhere, where do we look?
- Is there a script to test writing the data?
Updated by Gabriel Lander over 10 years ago
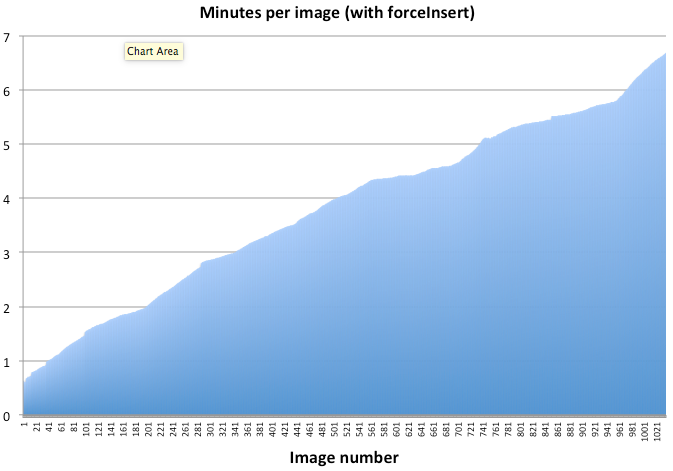
- File fullMakestack.png fullMakestack.png added
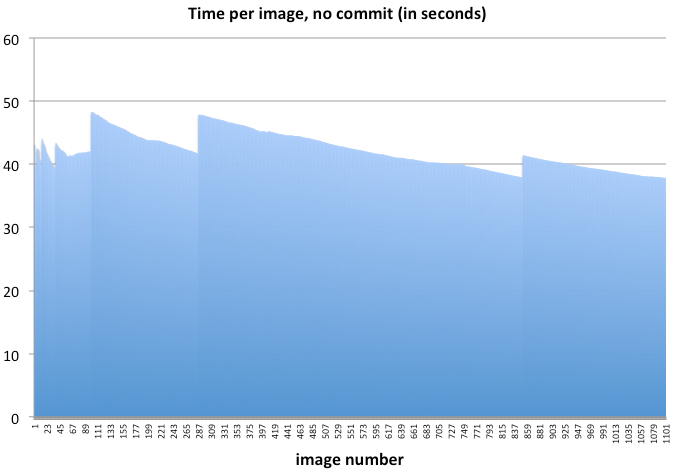
- File nocommit.png nocommit.png added
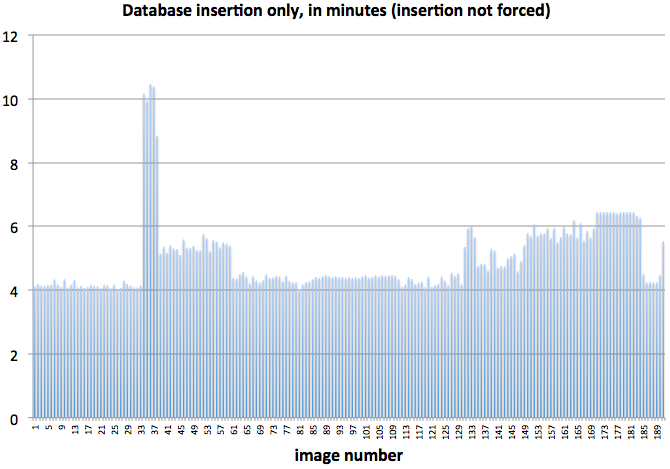
- File insertiononly.png insertiononly.png added
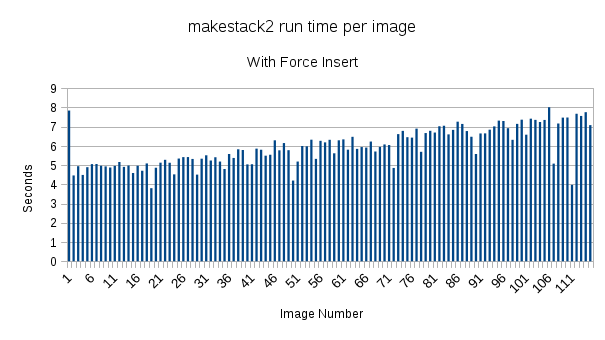
I'm attaching some plots that are very puzzling. When making a stack with the commit flag & forceInsertion=True, the time it takes to insert data from image 1 to image 1000 increases from ~30 seconds to 6.5 minutes.
However, neither the stack creation without insertion (~40seconds per image) or the insertion step (~4 minutes/image with forceInsertion=False) appear to increase in time.
The jumps in the "no commit" graph show the pauses where it makes an average image of the stack.
No idea what's going on. Thoughts on how to proceed?
Updated by Bridget Carragher over 10 years ago
Huh? Well this is at least data which is great. So what the heck else is this darned thing doing? There must be some other thing that happens that is causing the slowdown. There is likely no ghost in the machine....
What is the exact script that is being used to do this? Is there some way to put in timing steps so that we can watch this? Sargis do you have any ideas on this? Is thee a "debugger" that us applicable here?
Updated by Sargis Dallakyan over 10 years ago
Thank you for the updates Bridget and Gabe. Gabe's data is very useful. I've found a test case with ~40k images and I plan to reproduce Gabe's result. I don't have any credible idea as to what's causing this. My guess that it's either using more and more memory with each new image or doing some sort of computation that involves previous images in the stack. I've used Python profiler previously to check how often and for how long various parts of test2.py are executed.
Updated by Sargis Dallakyan over 10 years ago
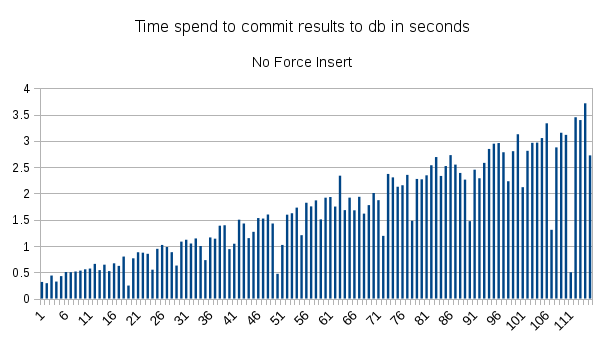
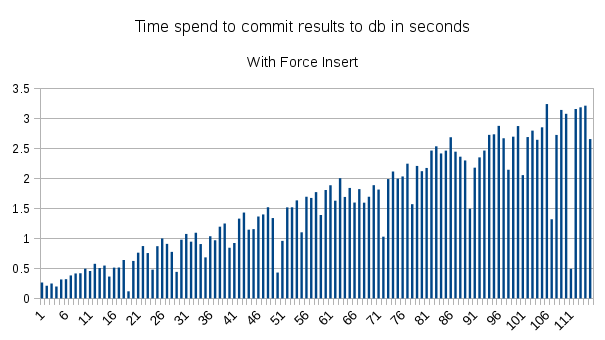
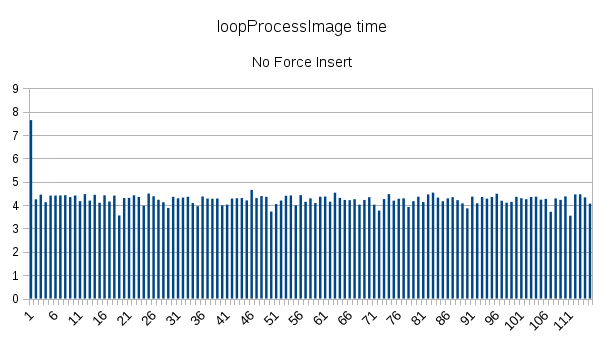
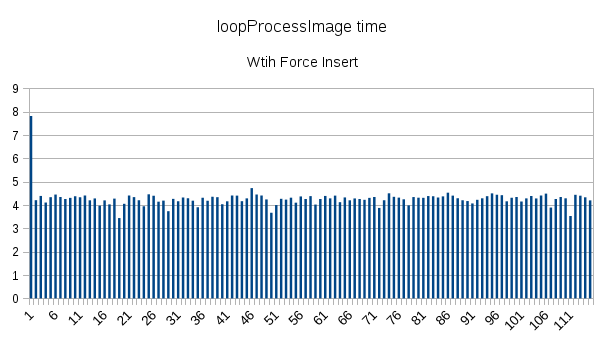
- File db_time_no_force_insert.png db_time_no_force_insert.png added
- File loopProcessImage_time_no_force_insert.png loopProcessImage_time_no_force_insert.png added
- File db_time_with_force_insert.png db_time_with_force_insert.png added
- File loopProcessImage_time_with_force_insert.png loopProcessImage_time_with_force_insert.png added
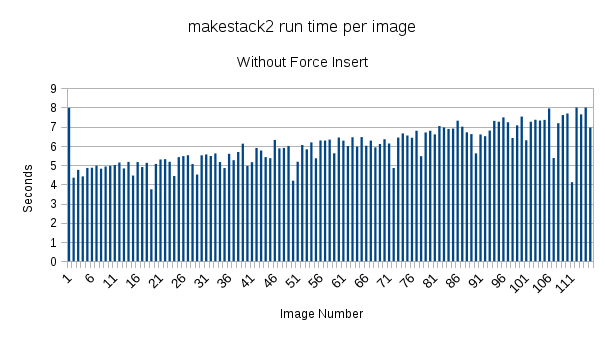
- File total_time_no_force_insert.png total_time_no_force_insert.png added
- File total_time_with_force_insert.png total_time_with_force_insert.png added
I did some computing and made some timing plots with and without forceInsert, which are similar to Gabe's result. I've run it on a test case with 115 images and ~20k particles. In my case, database, web and processing server are all running on the same machine with 6 core Intel i7-3930K CPU @ 3.20GHz and 36GB RAM. I've used time module and inserted start and and time around loopProcessImage and loopCommitToDatabase in AppionLoop.run as follows:
                start = time.time()
                results = self.loopProcessImage(imgdata)
                end = time.time()
                p_time_file.write(str(end - start)+"\n")
...
                        start = time.time()
                        self.loopCommitToDatabase(imgdata)
                        self.commitResultsToDatabase(imgdata, results)
                        end = time.time()
                        d_time_file.write(str(end - start)+"\n")
In both cases (with or without forceInsert), I've used clean stack table by deleting all previous stacks. Each image had ~20 to ~200 particles. Processing time stays the same with or without forceInsert, but database commit time has an increasing trend in both cases.
I've also run makestack2.py with python -m cProfile -s time to see where it spends most of the time:
   Ordered by: internal time

   ncalls  tottime  percall  cumtime  percall filename:lineno(function)
        1  692.276  692.276  692.276  692.276 {posix.waitpid}
        1    0.002    0.002    0.002    0.002 {posix.read}
        1    0.002    0.002    0.005    0.005 subprocess.py:389(<module>)
        1    0.001    0.001    0.004    0.004 pickle.py:25(<module>)
        1    0.001    0.001  692.291  692.291 appion:6(<module>)
        1    0.001    0.001    0.001    0.001 {posix.listdir}
      195    0.001    0.000    0.001    0.000 posixpath.py:68(join)
        5    0.001    0.000    0.001    0.000 sre_compile.py:208(_optimize_charset)
      319    0.000    0.000    0.000    0.000 {method 'match' of '_sre.SRE_Pattern' objects}
      190    0.000    0.000    0.004    0.000 glob.py:29(iglob)
      117    0.000    0.000    0.002    0.000 re.py:134(match)
        1    0.000    0.000    0.001    0.001 fnmatch.py:45(filter)
        1    0.000    0.000    0.000    0.000 {posix.stat}
      119    0.000    0.000    0.003    0.000 re.py:226(_compile)
        3    0.000    0.000    0.000    0.000 sre_compile.py:259(_mk_bitmap)
...
This shows that majority of the time is spend on running proc2d (posix.waitpid and subprocess). I've also plotted total compute time, which is roughly the sum of processing and database commit time. This shows that increasing trend is coming from database commit time.
I've installed line_profiler and will try to go deeper in the code to see what's going on.
Updated by Neil Voss over 10 years ago
Can we write ever single MySQL query made by sinedon to a file? so we can check what is going on. Or what queries are happening that slows down the commits.
Updated by Sargis Dallakyan over 10 years ago
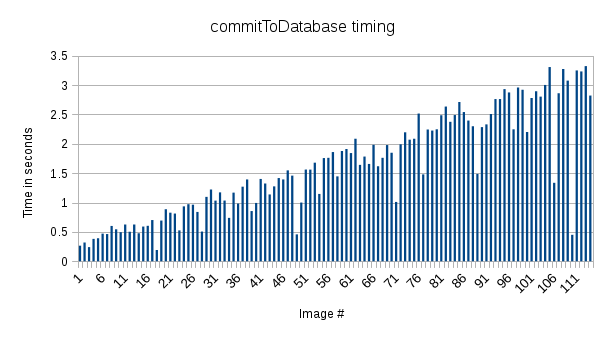
- File commitToDatabase_timing_modified.png commitToDatabase_timing_modified.png added
- File commitToDatabase_timing_orig.png commitToDatabase_timing_orig.png added
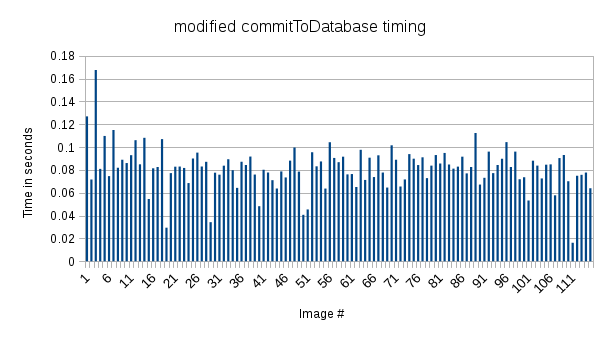
Thanks Neil. I've read commitToDatabase function in makestack2.py and I see that it does query database to find duplicate particle each time new particle is added. r18863 now won't run this forceInsert is set. I'm uploading new timing plots which shows that with this update commitToDatabase doesn't show increase trend with the number of images and it stays under sub-second scale through the process.
I've also changed runMakeStack2.php in r18862 so that "Fast Insert" is on be default.
Gabe, please try this new code when JC updates processing and myamiweb.
I'll try to find a test case for topologyAlignment.py to work on it next.
Updated by Neil Voss over 10 years ago
Good work Sargis!!! So the problem was not sinedon, it was an extra check in the makestack code. Along these lines I did a grep of 'results=1'. Here are some more suspect particle queries.
appion/bin/
HIP.py:            HipParticledata = HipParticle.query(results=1)
affinityPropCluster.py:        alignparts = alignpartq.query(results=1)
clusterCoran.py:        alignparts = alignpartq.query(results=1)
createSyntheticDataset.py:            stpartdata = stpartq.query(results=1)
imagicMSAcluster.py:        alignparts = alignpartq.query(results=1)
kerdenSOM.py:        alignparts = alignpartq.query(results=1)
makestack2.py:                stpartdata = stpartq.query(results=1)
otrVolume.py:        classpartdatas = classpartq.query(results=1)
rotKerdenSOM.py:        alignparts = alignpartq.query(results=1)
runSimpleClusterAndOrigami.py:        alignparts = alignpartq.query(results=1)
runXmipp3CL2D.py:        alignparts = alignpartq.query(results=1)
runXmippCL2D.py:        alignparts = alignpartq.query(results=1)
uploadXmippCL2D.py:        alignparts = alignpartq.query(results=1)
appion/appionlib/
./apEulerJump.py:        stackpartdata = stackpartq.query(results=1)
./apParticle.py:    partd = partq.query(results=1)
./apStack.py:    stackparticledata=stackq.query(results=1)
Updated by Sargis Dallakyan over 10 years ago
Need to make forceInsert=True to be the default for the command line too.
Updated by Sargis Dallakyan over 10 years ago
- Status changed from In Code Review to In Test
- Assignee changed from Sargis Dallakyan to Gabriel Lander
r18901 makes forceInsert the default option for makestack2.py.
Updated by Bridget Carragher over 10 years ago
Works? Surely there is much joy in Mudville tonight! :D :D :D :D :D :D :D